IFR - Infection Fatality Rate (notes)
This is history on this is written already. ‘The worst pandemic of our lifetime’ is now burned into societal norm, even though it has happened 2 (or 3) times in the past 100 years. The cross-product of shock of propaganda accuracy multiplied by the mental weakness of the population allows ‘them’ to write this history any way they see fit. Again, I picture what adults are saying to their children. ‘This is the worst pandemic in our lifetime, so wear the mask, take the jab, don’t see your friends, don’t go to church, cross the street if you see another person.’ The managerial classes enforcing this do so either through $$$ or moral superiority for a 0.0xxx% risk.
This is a short post to update my notes on IFR. There is so much analysis and debate around this, and the same groups separated out in to their echo chambers of alternate realities. I had to note these for myself to stay sane – what was ‘normal’ before 2020 and what is the new normal.
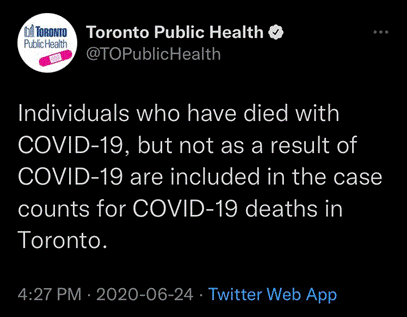
Once I saw multiple Health Officers lying outright about COVID deaths in mid 2020, I knew the the new normal was being written. Deena Hinshaw and Bonnie Henry as examples, allowed the press to run with infant deaths ‘due to COVID’. Only when pressed did they add the details that these infants passed due to other reasons but happened to test positive. Persons in positions of authority not only know this is a lie, but this is malicious if they know better.
The ‘infection fatality rate’ of any pandemic is usually estimated after a pandemic has passed. Johan Geisecke, former health official for Sweden, estimated in April 2020 that C19 ‘would be approximately two times a bad flu year’. A bad flu year is approximately 0.05% to 0.1% IFR, and C19 as of late 2020 and most of 2021 was declared to be at a median level of 0.1 to 0.2% (with a range), making it approximately two times a bad flu as Geisecke predicted.
The infection fatality rate (IFR) is still in flux (pandemic still ongoing) and usually has its final estimate years after the virus goes endemic. The initial case fatality rate (CFR) was flooding the media early on as 3%, and this helped drive the fear factor. Since then, the IFR based on many samples had settled at a range of 0% to 1%, median value approximately 0.15%
Fatality rate (IFR). Initially it was all over news that fatality rate is 3% (compared to a ‘bad’ seasonal influenza at 0.1% – even this figure is debatable – could be as low as 0.02% for mild season). The Imperial College models (Neil Fergusson) were used at IFR = 1% by almost all the world to initially use the ‘precautionary principle’ to lockdown like China did (except Sweden, whom Fergusson predicted would suffer 40,000-90,000 deaths yet have had 7,700 by mid 2021).
The WHO and CDC have accepted (as of Oct. 2020) and published that C19 median IFR is 0.15%, range of 0 to 1.5%. This peer-reviewed and accepted paper took 3 revisions and 7 months of reviews: ID: BLT.20.265892 pdf, 878kb (who.int)
From the U.K, in October 2021, Opposition member Steven Baker asked what the estimate for IFR was, answer 0.096%:
The WHO stated in Oct. 2020, that after 10 months of spread (or 1 year given China had cases in August 2019), the estimation of infections was 10% of the world, or 780 million people. Deaths at that time (using their own trackers) were 1.1 million. This yields IFR = 0.14%. Keep in mind the WORLDOMETERS/John Hopkins/FT and other trackers only show ‘Cases’. In Oct. 2020, those were around 35 million, which is why people assume/report ‘fatality ratio’ = 1.1/35 = 3%. (This is the ‘CFR vs IFR’ mixup).
(Source: WHO Estimates Coronavirus Infected 10% Of World’s Population (forbes.com)
The IFR is much more age-specific than influenza. That is, from age 0 to 50, C19 IFR is lower than influenza, and above 60 years, it is higher. The CDC updated its IFR estimates to the following age-ranges:
0-19 years: 0.003%
20-49 years: 0.02%
50-69 years: 0.5%
70+ years: 5.4%Source: COVID-19 Pandemic Planning Scenarios | CDC)
Sources:
COVID-19 (https://www.acsh.org/news/2020/06/23/coronavirus-covid-deaths-us-age-race-14863)
Influenza (https://www.cdc.gov/flu/about/burden/2018-2019.html).
The Economist, Sept. 15, 2020, summarized dozens of seroprevalance studies to arrive at an estimated infection count of 630 million. Deaths then were just under 1 million. IFR = 0.15%
Comparisons to previous pandemics. The 1918 pandemic IFR was 3%. Both 1958 and 1968 pandemics were 0.1 to 0.2% (close to C19). Both killed up to 4 million at a time when world population was half what it is today. Note the table below shows ‘CFR’ but it is actually IFR (estimated deaths divided by estimated infections). Note again that these were deaths directly due to the virus, not ‘any death with a positive test’
Sources: Revisiting the 1957 and 1968 influenza pandemics – The Lancet
And a few more follow-up notes on co-morbidities.
All major countries’ data shows that the majority of deaths is strongly correlated to morbidities. Alberta health stats below are one such example. In the USA, deaths ‘with’ C19 had on average 3 co-morbidities.
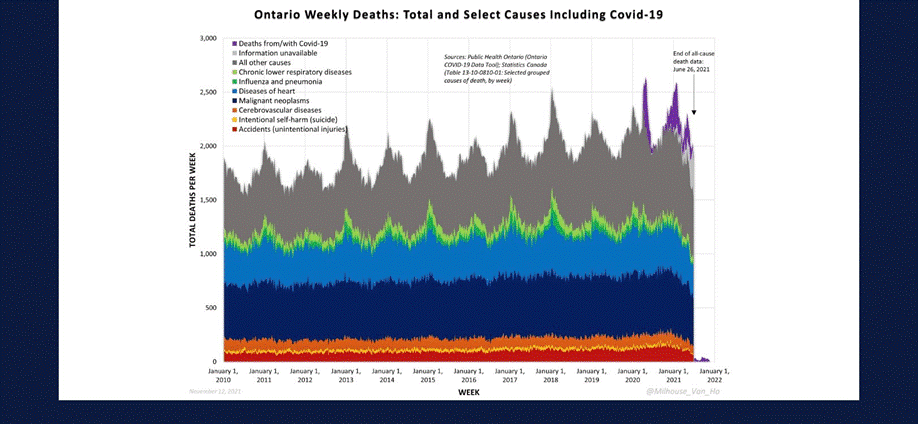
Looking at all-cause mortality for Ontario as an example. Somehow neoplasms, influenza+pneumonia dipped down for 2020 and deaths ‘with C19’ took their place. The peaks for C19 were similar to the bad flu year for 2017/2018, when adjusted for overall population growth trend (up 1% per year).
Data from the USA shows that ‘with C19’ deaths involved 3 or 4 other causes of death. But since the ‘any death for any reason with a positive PCR test’ was applied, they were all marked COVID. If in each year (2020 and 2021) approximately 400,000 ‘with C19’ deaths occurred, and, if we are generous and assume half of those were due to any of these other causes, then perhaps the actual deaths were 200,000 each year. Compare this to the last worst influenza year (2018), in which 67,000 deaths occurred directly due to influenza. That’s a factor of 3.
Similar for Canada. The last worst influenza season (also 2018), saw around 8500 deaths directly from the flu (average for 2015-2019 was 7300 per year). If our (roughly) 30,000 deaths (start of 2022 so almost 2 years) were also ‘for any reason within x days of a positive PCR test’, then that 30k figure would come down. Even at 30,000, that puts it at two times the two-year average for influenza deaths (14,600).
A more-recent IFR study came out in February 2022, from the IHME, stating an IFR range of 0.14 to 0.55%. Slightly higher than the Iaonnidis studies. We can take this one with a grain of salt since IHME is owned and run by the Bill and Melinda Gates Foundation.
Funding
Bill & Melinda Gates Foundation, J Stanton, T Gillespie, and J and E Nordstrom
Role of the funding source
The funders of the study had no role in the study design, data collection, data analysis, data interpretation, or the writing of the report.
Finally a comparison for British Columbia:
B.C., end of 2021 vs 2020:
BCCDC COVID-19 Epidemiology App (shinyapps.io)
Note approximately 0.75% of population dies each year, 2020-2021 was statistically the same as any severe influenza year. For context, in the two years March 2020-March 2022, (0.75% * 5.1million * 2) = 77,000 deaths from all causes, versus approximately 2300 death ‘with a positive PCR C19 test’. We used to have something called ‘proportional response’ based on ALL health issues. Again the logical fallacies come out to defend the State: ‘would have been worse’, ‘see, our lockdowns, masks, and distancing worked!’


33% of people care not for the truth.
33% could be convinced of the truth.
33% of people know the probable truth.